| Feature | Political Map | Physical Map |
|---|---|---|
| Primary Focus | Political boundaries and divisions | Natural features and physical characteristics |
| Key Elements | Countries, states, cities, capitals | Mountains, rivers, oceans, forests, topography |
| Representation | Borders, labels, color coding | Contours, shading, water body symbols, landform symbols |
| Common Uses | Geopolitical understanding, education, travel planning | Geological studies, outdoor activities, environmental conservation, climate research |
| Labeling | Precise labeling of cities, capitals, and countries | Emphasizes elevation and terrain, rather than labeling specific locations |
| Color Coding | Countries are assigned unique colors, often based on historical or cultural significance | Colors are used to depict elevation, with lighter colors indicating higher elevations |
| Cartographic Symbols | Symbols may include national and state capitals, roads, and landmarks | Symbols represent geographical features like mountains, rivers, forests, and landforms |
| Contours and Shading | Political maps generally lack contour lines and shading | Essential for showing elevation and relief, helping visualize landforms and terrain |
| Scale and Detail | Typically larger scale and more detailed for urban areas | Varies depending on the specific map but generally emphasizes topography and landforms over urban details |
| Data Sources | Data sources include administrative boundaries, population data, and geopolitical information | Data sources include topographic surveys, geological data, and geographical studies |
| Map Legends | Legends explain political symbols, color codes, and labels | Legends clarify contour intervals, shading patterns, and symbols used for natural features |
| Projection Types | Various map projections used, such as Mercator, to display political boundaries | Projections may vary but often emphasize accurate representation of geographical features |
| Use Cases | Ideal for understanding countries, states, cities, and geopolitical relationships | Perfect for exploring geographical features, landforms, and natural beauty |
| Specialized Maps | Includes thematic maps for specific themes (e.g., population density) | Includes topographic maps, geological maps, weather maps, and nautical charts |
| Examples | World maps, country maps, state maps | Topographic maps, relief maps, terrain maps |
You see, the world of maps is a treasure trove of information, but it’s crucial to know when to reach for a political map and when to pick up a physical map. These two map categories are like yin and yang, each offering a unique perspective on our planet. A political map is your trusty guide to geopolitical boundaries, helping you make sense of countries, states, and cities, while a physical map invites you to a journey through Earth’s natural beauty, revealing mountains, rivers, and breathtaking landscapes.
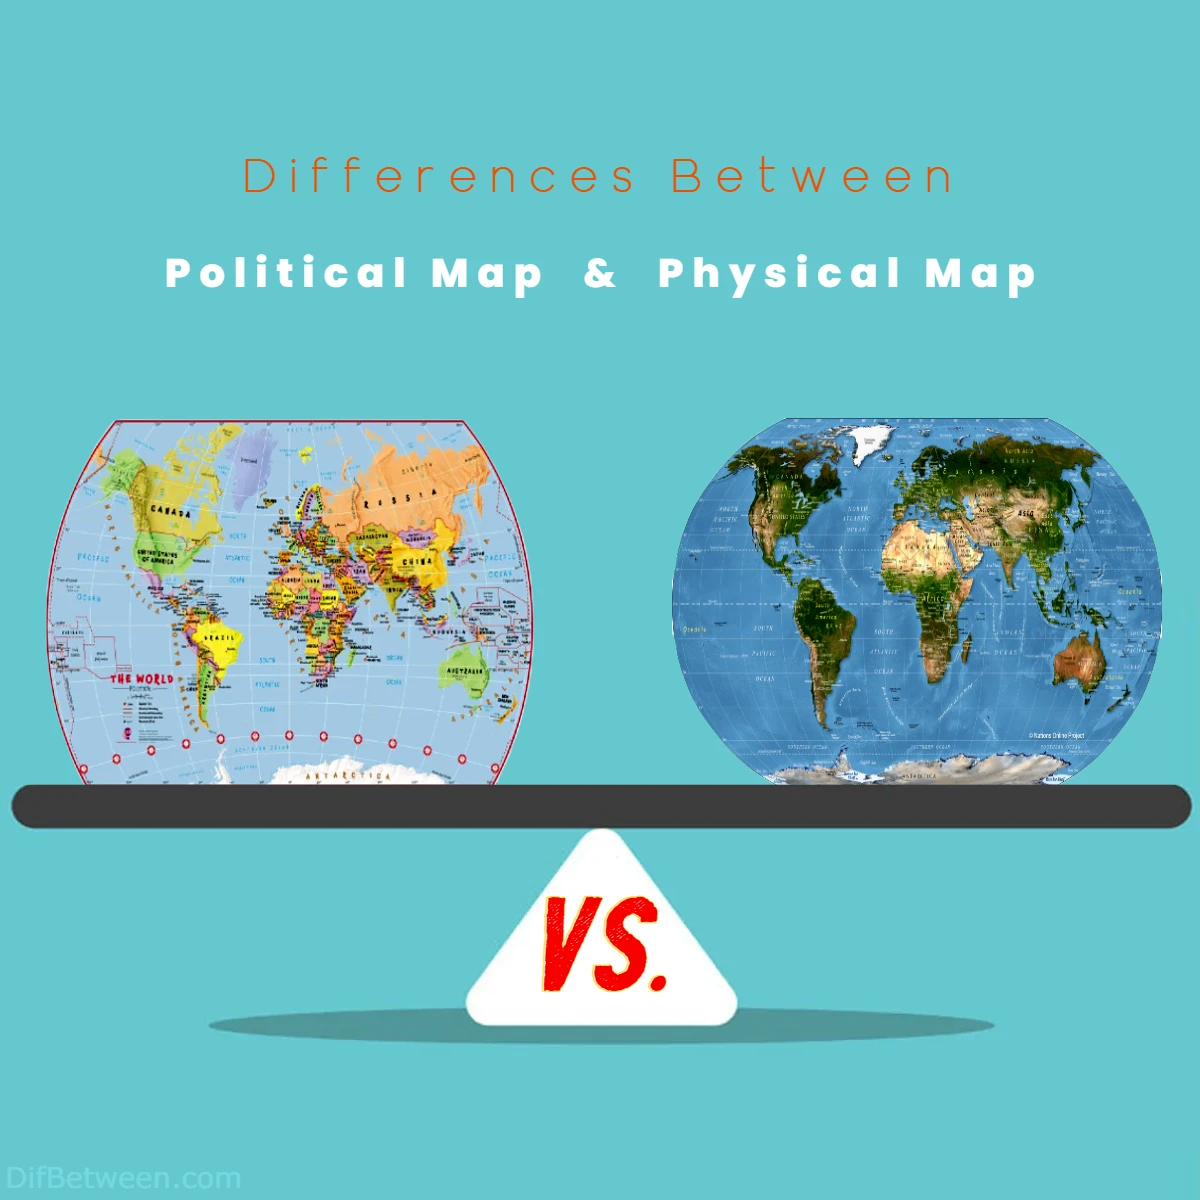
Differences Between Political Map and Physical Map
The main differences between Political Maps and Physical Maps lie in their core focus and purpose. Political Maps emphasize human-made divisions and boundaries, showcasing countries, states, cities, and administrative regions, making them invaluable for geopolitical understanding and educational use. In contrast, Physical Maps celebrate the Earth’s natural beauty, vividly displaying geographical features like mountains, rivers, deserts, and oceans, making them essential for outdoor enthusiasts, geological studies, and environmental conservation. So, while Political Maps navigate the man-made world, Physical Maps invite you to explore the Earth’s breathtaking natural landscapes.
Understanding the Basics
Political maps are like the road signs of the map world. They are designed to help us navigate the complex landscape of political boundaries. These maps primarily focus on man-made divisions, such as countries, states, cities, and administrative regions. When you think of a typical world map with bold, colorful lines separating countries, you’re picturing a political map.
On the other hand, physical maps are akin to nature’s artwork. They capture the physical features of the Earth’s surface. This includes landforms like mountains, valleys, rivers, deserts, and bodies of water like oceans, seas, and lakes. Physical maps provide a detailed portrayal of the natural world, helping us understand the topography and geology of an area.
Now that we’ve laid down the basic definitions, let’s dive deeper into the distinctions between these two types of maps.
Purpose and Focus
Political Map: Boundaries and Borders
Political maps have a clear-cut purpose: to delineate political boundaries and divisions. Their primary focus is on human-made entities. These include countries, states, provinces, and cities. They help us understand the world’s administrative structure, displaying the names of places and their borders. When you want to find out which countries share a border with another, a political map is your go-to.
One of the most iconic examples of a political map is the world map, often seen in classrooms and reference materials. It vividly depicts the countries of the world, their capitals, and significant cities.
In the table below, we summarize the key features of a political map:
| Key Features | Description |
|---|---|
| Focus | Political boundaries and divisions |
| Key Elements | Countries, states, cities, capitals |
| Primary Purpose | Understanding administrative structure |
| Examples | World maps, country maps, state maps |
Physical Map: Nature’s Canvas
Physical maps, in contrast, celebrate the beauty of the Earth’s natural features. Their purpose is to portray the physical characteristics of an area, including landforms, water bodies, vegetation, and relief features. These maps help us explore the world’s diverse topography and understand the geological aspects of a region.
Physical maps are invaluable for geographers, geologists, and anyone interested in Earth’s physical geography. They offer insights into the distribution of mountains, rivers, deserts, and more. For example, if you’re planning a hiking trip, a physical map can help you identify the best trails and understand the terrain.
Here’s a summary of the key features of a physical map:
| Key Features | Description |
|---|---|
| Focus | Natural features and physical characteristics |
| Key Elements | Mountains, rivers, oceans, forests, topography |
| Primary Purpose | Exploring Earth’s physical geography |
| Examples | Topographic maps, relief maps, terrain maps |
Cartographic Representation
Political Map: Borders and Labels
Political maps are renowned for their distinct visual cues. They employ a variety of cartographic techniques to represent political boundaries and labels. Here are some of the common features you’ll find on a political map:
- Borders: Bold, often colorful lines define the boundaries of countries, states, and regions. These lines are usually sharp and easily distinguishable.
- Labels: Cities, capitals, and important landmarks are labeled clearly. Text size and style are carefully chosen to ensure legibility.
- Color Coding: Different colors are used to differentiate countries and regions. This makes it easy to identify and distinguish between political entities.
- Legend: A legend or key is often included to explain the symbols, colors, and labels used on the map. This aids map interpretation.
Physical Map: Natural Aesthetics
Physical maps, on the other hand, aim to capture the beauty and complexity of nature. Their cartographic representation is focused on highlighting the Earth’s natural features. Here’s how physical maps achieve this:
- Contours: Contour lines are used to represent elevation, showing the shape of mountains and valleys. Closer lines indicate steeper terrain.
- Shading: Different shades and colors are employed to depict elevation and relief. Lighter colors may indicate higher elevations, while darker shades represent lower areas.
- Water Bodies: Oceans, seas, lakes, and rivers are shown with appropriate symbols. Blue is the dominant color for water bodies.
- Vegetation: Forests, grasslands, and other types of vegetation are often depicted using various shades of green.
- Landforms: Mountains, hills, and plateaus are represented using appropriate symbols, allowing viewers to identify these features easily.
In essence, while political maps use distinct lines and labels to represent political divisions, physical maps use contours and colors to showcase the Earth’s natural beauty.
Usage Scenarios
Political Map: Geopolitical Understanding
Political maps find extensive use in a variety of scenarios where understanding geopolitical boundaries is crucial. Here are some common applications:
- World Affairs: Political maps are indispensable in international relations and diplomacy. They help governments, organizations, and individuals navigate the geopolitical landscape.
- Education: These maps are frequently used in schools to teach students about countries, capitals, and borders. They provide a foundational understanding of the world.
- Travel Planning: When planning international travel, political maps are handy for identifying neighboring countries and planning routes.
- Election Analysis: Political maps play a significant role in election analysis, helping visualize voting patterns and constituencies.
- Demographic Studies: Researchers use political maps to study population distribution, urbanization, and regional demographics.
Physical Map: Environmental Exploration
Physical maps are a treasure trove for those interested in Earth’s natural beauty and environmental factors. Here are some areas where they are invaluable:
- Geological Studies: Geologists use physical maps to study the Earth’s crust, tectonic plates, and landforms, aiding in mineral exploration.
- Outdoor Activities: Hikers, campers, and outdoor enthusiasts rely on physical maps to navigate terrain, find trails, and explore nature.
- Environmental Conservation: Conservationists use physical maps to identify ecologically significant areas, helping protect natural habitats.
- Climate Research: Physical maps are used in climate research to understand weather patterns, ocean currents, and their effects on the environment.
- Education and Research: Physical maps are essential in geography education and scientific research, helping us better understand our planet’s physical processes.
In summary, political maps are your guides to the geopolitical world, while physical maps are your tickets to a journey through Earth’s stunning landscapes.
Key Features Comparison
Let’s take a closer look at the key features that set political and physical maps apart.
| Feature | Political Map | Physical Map |
|---|---|---|
| Focus | Political boundaries and divisions | Natural features and physical characteristics |
| Key Elements | Countries, states, cities, capitals | Mountains, rivers, oceans, forests, topography |
| Representation | Borders, labels, color coding | Contours, shading, water body symbols, landform symbols |
| Common Uses | Geopolitical understanding, education, travel planning | Geological studies, outdoor activities, environmental conservation, climate research |
Map Legends: Decoding Symbols
Map legends are crucial components of both political and physical maps. They help viewers understand the symbols and colors used on the map. Here’s a quick guide to some common map symbols you’ll encounter on these maps:
Political Map Legends
- Country Borders: A solid line with distinct colors separates one country from another. The colors are often unique to each country.
- State or Province Borders: Similar to country borders, but on a smaller scale, these lines divide states or provinces within a country.
- City Icons: Small dots or circles with names label cities. Capital cities are often marked with a star.
- Roads and Highways: A hierarchy of lines and dashes indicates roads, with varying line styles representing different road types.
- Airports: An airplane symbol is used to mark airports, and their size may vary based on the airport’s significance.
Physical Map Legends
- Contour Lines: These lines represent elevation and show the shape of mountains and valleys. Closely spaced lines indicate steep terrain, while widely spaced lines represent gentle slopes.
- Water Bodies: Symbols like waves or lines denote rivers and streams. For lakes, a blue-filled shape is used.
- Mountains and Hills: Pictorial representations, often resembling peaks, are used to depict mountains and hills.
- Forests and Vegetation: Shades of green represent different types of vegetation. Darker green may indicate dense forests, while lighter shades represent grasslands.
- Deserts: Deserts are usually marked with a combination of colors and symbols, depicting arid regions.
Understanding these legends is key to interpreting both political and physical maps effectively.
The Overlapping World: Hybrid Maps
In our exploration of the world of maps, we’ve covered political and physical maps as distinct entities. However, there’s a fascinating convergence point where these two map types overlap. These are known as hybrid maps or topographic maps.
What Are Hybrid Maps?
Hybrid maps combine the features of both political and physical maps, offering a comprehensive view of an area. They include political boundaries, cities, and labels, as well as natural features like mountains, rivers, and forests. These maps are particularly useful for activities that require an understanding of both geopolitical and environmental aspects.
When to Use Hybrid Maps
- Outdoor Adventures: If you’re planning a hiking or camping trip, a hybrid map can guide you by showing both the terrain and nearby cities for supplies.
- Geographical Research: Geographers often rely on hybrid maps to study the interaction between human activity and natural features.
- Urban Planning: Urban planners use hybrid maps to understand the physical environment and the distribution of urban areas.
- Tourism and Recreation: When exploring a new city or region, a hybrid map provides a holistic view, helping you navigate the urban landscape and discover natural attractions.
While political and physical maps each have their unique strengths, hybrid maps offer a bridge between these two worlds, making them versatile tools for various purposes.
Mapmaking in the Digital Age
In today’s digital age, mapmaking has undergone a significant transformation. The availability of Geographic Information Systems (GIS) and online mapping platforms has revolutionized how we access and interact with maps. Let’s explore how technology has impacted the world of mapping.
Interactive Maps
Online mapping services like Google Maps and interactive GIS platforms have made maps more accessible than ever. Users can zoom in, pan around, and even overlay different map layers to customize the information they need. This level of interactivity has revolutionized navigation, travel planning, and location-based services.
Real-Time Data
One of the most significant advantages of digital mapping is the ability to incorporate real-time data. Users can access up-to-the-minute information about traffic, weather, and points of interest. This real-time data enhances the utility of maps for daily life, from choosing the quickest route to finding the nearest restaurant.
Customization
Digital maps also offer customization options. Users can add waypoints, create their own maps, and highlight specific areas of interest. This has been a game-changer for businesses, urban planners, and researchers who need tailor-made maps for their projects.
Geographic Information Systems (GIS)
GIS technology is the backbone of digital mapping. It enables the collection, analysis, and visualization of geographic data. This technology has transformed fields like urban planning, disaster management, and environmental conservation.
Satellite Imagery
Digital maps can incorporate high-resolution satellite imagery, providing a level of detail that was unimaginable with traditional paper maps. This imagery is invaluable for fields like agriculture, forestry, and urban development.
Augmented Reality (AR) Maps
The advent of AR has brought maps to life. AR maps use your device’s camera and sensors to overlay digital information onto the real world. For example, you can point your phone at a street and see information about businesses and restaurants in your view.
Global Positioning System (GPS)
GPS technology has made navigation and location-based services ubiquitous. It relies on a network of satellites to provide precise location data, helping you find your way with pinpoint accuracy.
The integration of these technologies has elevated the world of mapping, making it an essential part of our daily lives. Whether you’re navigating a city, planning a vacation, or conducting in-depth research, digital maps have become invaluable tools.
Political Maps in Detail
Political Map Labels
Political maps are known for their clear and precise labeling of cities, capitals, and countries. These labels are often essential for various purposes, from navigation to education. The size, font, and style of these labels are carefully chosen to ensure readability. For example, capital cities are typically labeled with a star icon to distinguish them from other cities.
Political Map Colors
The use of colors in political maps is not arbitrary; it follows certain conventions. Each country is assigned a unique color, making it easy to identify and distinguish between them. Additionally, the choice of colors can sometimes carry historical or cultural significance. For example, the use of red for China and blue for the United States on a world map.
Political Map Legends
As mentioned earlier, political maps feature legends or keys that explain the symbols, colors, and labels used on the map. These legends help users understand the map’s content without cluttering the map itself. Some political maps may also include symbols for national capitals, major cities, and important landmarks.
Political Map Projection
Political maps often use different map projections to display the spherical Earth on flat surfaces. Some common map projections include the Mercator projection, which preserves angles and is great for navigation, and the Robinson projection, which provides a more accurate depiction of continents but distorts sizes and shapes.
Physical Maps in Detail
Physical Map Contour Lines
Contour lines on physical maps play a significant role in portraying the landscape’s elevation. These lines connect points of equal elevation above or below a reference point (usually sea level). The spacing and patterns of contour lines reveal the steepness or gentleness of the terrain. Closely spaced contour lines indicate steep slopes, while widely spaced lines represent flatter areas.
Physical Map Shading and Relief
Shading and relief are essential aspects of physical maps. Shading uses various colors and patterns to show the elevation of the land. Lighter colors are used for higher elevations like mountains, while darker shades represent lower areas like valleys. Relief maps, in particular, use shading to make the landforms appear three-dimensional, providing a realistic view of the terrain.
Physical Map Symbols
In addition to contour lines and shading, physical maps use symbols to represent various geographical features. These symbols can include triangles for mountains, wavy lines for rivers, and green areas for forests. The careful use of symbols allows map readers to quickly identify and understand the types of natural features present in an area.
Physical Map Terrain Representation
Physical maps go beyond basic representations of landforms. They often depict more intricate details, such as the location of glaciers, sand dunes, volcanic features, and even the depth of the ocean floor. This level of detail is crucial for geologists, ecologists, and environmental scientists studying specific regions.
Specialized Maps
Besides the standard political and physical maps, there are several specialized map types that cater to specific interests and fields of study. Here are a few notable ones:
Thematic Maps
Thematic maps focus on a single theme or topic, such as population density, climate, or land use. These maps use various techniques to represent data, such as color-coding or graduated symbols, to convey specific information effectively.
Nautical Charts
Nautical charts are essential for marine navigation. They provide mariners with detailed information about water depths, coastlines, and navigational hazards. Nautical charts also include information about tides, currents, and the locations of lighthouses and buoys.
Topographic Maps
Topographic maps are highly detailed physical maps that show not only elevation but also features like roads, trails, and land use. These maps are invaluable for hikers, surveyors, and anyone needing precise information about the terrain.
Weather Maps
Weather maps provide current and forecasted meteorological information, including temperature, pressure systems, wind patterns, and precipitation. These maps help meteorologists track and predict weather conditions.
Geologic Maps
Geologic maps display the distribution of rock types, faults, and geological features in a specific area. These maps are crucial for understanding the Earth’s geological history and for natural resource exploration.
Political Map or Physical Map: Which One is Right Choose for You?
Choosing between a political map and a physical map depends on your specific needs and interests. Let’s explore the factors that can help you decide which type of map is the right choice for you:
When to Choose a Political Map
Geopolitical Exploration:
- Choose a political map if you’re interested in understanding the political divisions of the world. It’s your go-to map for exploring countries, states, cities, and their boundaries.
Travel and Navigation:
- If you’re planning a trip and want to know which countries share borders with your destination or which cities are nearby, a political map is ideal.
Educational Purposes:
- In educational settings, political maps are essential for teaching students about geography, world capitals, and international boundaries.
Election Analysis:
- Political maps are crucial for understanding election results, constituency boundaries, and voting patterns.
Demographic Studies:
- Researchers often rely on political maps to study population distribution, urbanization, and regional demographics.
When to Choose a Physical Map
Natural Beauty and Geography:
- If you’re passionate about the Earth’s natural beauty and want to explore its landforms, rivers, mountains, and deserts, a physical map is your best choice.
Outdoor Adventures:
- For outdoor enthusiasts, hikers, campers, and nature lovers, a physical map provides essential information on terrain, trails, and natural landmarks.
Geological Studies:
- Geologists and scientists use physical maps to analyze the Earth’s crust, tectonic features, and landforms.
Environmental Conservation:
- Conservationists rely on physical maps to identify ecologically significant areas, aiding in efforts to protect natural habitats.
Climate Research:
- Climate researchers use physical maps to understand weather patterns, ocean currents, and their impact on the environment.
When a Hybrid Map Might Be Right
Exploring New Cities:
- When exploring a new city or region, a hybrid map that combines political and physical elements can help you navigate urban areas while discovering nearby natural attractions.
Geographical Research:
- Geographers often use hybrid maps to study the interaction between human activity and natural features in specific regions.
Urban Planning:
- Urban planners benefit from hybrid maps to understand both the physical environment and the distribution of urban areas.
Tourism and Recreation:
- When on a vacation, a hybrid map can offer a holistic view of the destination, assisting you in exploring urban centers and natural wonders.
In summary, the choice between a political map and a physical map is about your specific interests and needs. Both maps offer valuable insights, so understanding their distinct purposes will help you make an informed decision. And remember, in this digital age, interactive maps and GPS applications can offer the best of both worlds, allowing you to access political and physical map data with ease.
FAQs
A Political Map is a type of map that primarily focuses on man-made divisions, such as countries, states, cities, and administrative regions. It is designed to help us understand political boundaries and divisions.
A Physical Map, on the other hand, showcases the physical features of the Earth’s surface, including landforms, rivers, mountains, and bodies of water. It highlights the natural world’s beauty and complexity.
The key differences lie in their focus and content. Political Maps emphasize political boundaries, countries, and cities, while Physical Maps showcase natural features like mountains, rivers, and deserts. Political Maps guide you through the geopolitical world, while Physical Maps invite you to explore Earth’s natural beauty.
You should opt for a Political Map when you want to understand geopolitical divisions, plan international travel, analyze election results, or study demographic data related to administrative regions.
Physical Maps are perfect for outdoor activities, geological studies, environmental conservation, and climate research. If you’re interested in the Earth’s natural beauty and topography, a Physical Map is the way to go.
Yes, there are hybrid maps that combine both political and physical elements, offering a holistic view of an area. These maps are useful for various purposes, including urban planning and tourism.
In the digital age, interactive maps, real-time data, customization, Geographic Information Systems (GIS), satellite imagery, and augmented reality (AR) have revolutionized the way we access and interact with maps.
Specialized maps include thematic maps (e.g., population density), nautical charts for marine navigation, topographic maps for detailed terrain information, weather maps for meteorology, and geologic maps for understanding rock types and geological features.
Read More:
Contents


